Blog
Real-time sales reporting tools for RevOps leaders in 2026
July 22, 2026
Read more
April 22, 2026
Acquisition costs and budget pressure are both rising. The 2025 CMO Survey found that 63 percent of CMOs now report increased pressure from CFOs, up from 52 percent the prior year. While benchmark data also shows higher customer acquisition and selling costs across B2B.
For revenue and finance leadership, that makes defensible numbers essential for planning spend, justifying decisions to the board, and figuring out where the funnel is leaking value.
The problem is that most cost per lead (CPL) benchmarks floating around are either outdated, channel-specific, or cross-industry averages that tell you nothing about whether your numbers are competitive in your market.
This guide covers what CPL is, why it matters beyond a marketing dashboard, 2026 industry benchmarks, and practical ways to reduce CPL without sacrificing lead quality.
Average cost per lead is the total marketing and sales spend required to generate one lead over a given period, calculated by dividing total spend by total leads acquired.
It is one of the most widely used efficiency metrics in demand generation because it allows revenue and finance teams to compare the cost-effectiveness of different channels, campaigns, and markets on a consistent basis.
The formula in plain language: total spend / number of leads = CPL. If you spend $50,000 in a quarter and generate 200 leads, your CPL is $250.
One distinction worth keeping clear: channel-level CPL measures the cost of leads from a single source such as paid search, organic content, or events. Blended CPL averages costs across all channels.
Blended CPL is the figure most useful for planning and benchmarking because it reflects the full cost of your demand generation program, not just one slice of it.
CPL is often tracked by marketing, but its implications run directly into revenue planning, finance modeling, and board-level reporting. Here is why it deserves attention across leadership:
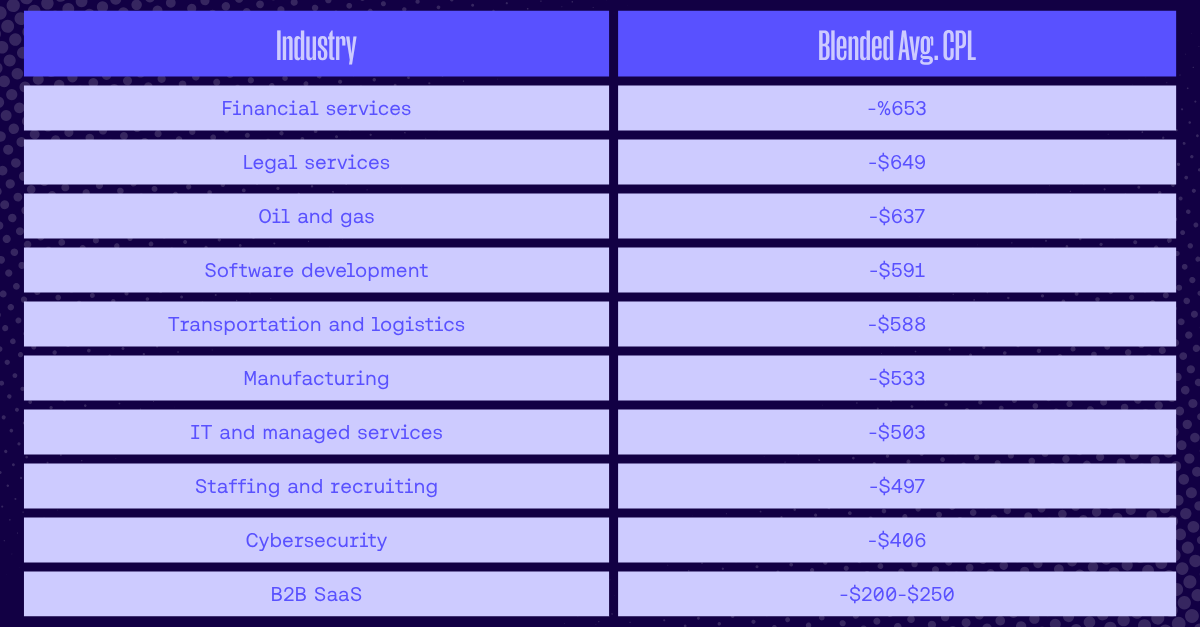
Figures represent average blended CPL across channels for each industry in North America. They will vary by geography, channel mix, and offer.
Use Outreach's Sales ROI Calculator to see how your acquisition spend maps to pipeline output and closed revenue — so you're optimizing for return, not just cost.
Benchmark tables tell you where your industry lands. Understanding what moves CPL within that range is what lets you do something about it.
Industries with larger average contract values and longer sales cycles tend to carry higher CPLs because the market expects more sophisticated, trust-building content before a buyer engages. Financial services, legal, and higher education all fit this pattern. When deal sizes justify it, a higher CPL can represent sound economics, not waste.
Paid search in high-competition categories commands premium keyword costs that inflate CPL significantly. According to Search Engine Land's analysis of 2025 Google Ads benchmark data, average cost per click (CPC) across all industries reached $5.26, with CPC increasing for 87 percent of industries.
Organizations that over-index on expensive paid channels without balancing the mix tend to run CPLs well above industry average. Competitive density in the ad auction directly affects what each lead costs.
Geography can change the math materially within the same industry. A financial services firm targeting enterprise accounts in New York will face meaningfully different acquisition costs than one targeting mid-market accounts in the Midwest, even with an identical channel mix.
Organizations with stronger thought leadership and category visibility can create demand more efficiently. Research from Edelman and LinkedIn found that 75 percent of decision-makers and C-suite executives said a piece of thought leadership led them to research a product they were not previously considering.
Offer design matters too: a high-value content asset or clearly differentiated free trial generates more conversions per dollar than a generic "book a demo" page in a saturated market.
Lowering CPL is only worthwhile if lead quality holds. These tactics address acquisition efficiency while maintaining the lead quality that downstream conversion depends on.
Start by defining your ideal customer profile (ICP) at the firmographic level: industry, company size, revenue range, and technology stack. Then layer in behavioral signals: what actions indicate real buying intent rather than casual interest.
Run this definition past both sales and marketing before applying it to campaign targeting. Audiences built on vague criteria inflate CPL with low-intent contacts who were never likely to convert. Tighter targeting typically reduces volume in the short term and improves lead quality and CPL efficiency in the medium term.
Pull your CPL by channel and pair it with conversion rate at each stage of the funnel. A channel with a low CPL that converts at a poor rate is more expensive than it looks. A channel with a higher CPL that converts consistently is more efficient than it looks. Shift budget toward channels where the full funnel math is strongest, not just where leads are cheapest to acquire.
The paid-versus-organic gap is worth examining directly. First Page Sage data shows organic CPL is 47 percent lower in B2B SaaS and 34 percent lower in legal services than paid CPL for the same categories. If your blended CPL is climbing and your channel mix is weighted heavily toward paid, that is the first variable to adjust.
Reducing blended CPL over time means building acquisition channels that do not charge per click. That requires a content foundation: a consistent publishing cadence targeting the search terms your buyers use when they are researching problems, not just when they are ready to buy. Start by mapping the questions your best customers ask before they engage, then build content that answers those questions with enough depth to rank.
Pair that with technical SEO basics (fast load times, clean site structure, well-structured internal linking) and organic leads begin to compound in a way paid campaigns cannot replicate.
The timeline is longer than a paid campaign, but organic CPL consistently runs well below paid CPL in most B2B categories once the content base is established.
Set a maximum response time for every inbound lead and make it visible. Research consistently shows that leads contacted within an hour are far more likely to qualify than those reached a day later.
Harvard Business Review found the gap is nearly seven times in qualification likelihood. Most teams are nowhere close: the average response time across B2B companies is over 40 hours.
The fix is an operational one. Assign routing rules so every lead reaches a rep immediately. Set alerts when leads age past your threshold. Review your routing logic every quarter to catch drift. Speed-to-contact is the highest-return CPL lever available and it costs nothing to improve.
Before running any CPL optimisation, get sales and marketing in the same room and agree on what a qualified lead actually looks like.
That means a written definition covering the firmographic criteria, the behavioral signals, and the minimum engagement threshold a lead must meet before it enters the sales workflow.
Without that agreement, marketing will optimize for the metric they can control (volume) and sales will reject leads that technically hit the target but never had real buying intent.
CPL benchmarks are useful guardrails, but whether a given CPL makes sense depends on what happens after a lead enters your system. A $200 CPL converting at 2 percent is worse economics than a $400 CPL converting at 12 percent.
Benchmarks tell you if your acquisition cost is in range for your industry; your execution determines whether that spend turns into qualified pipeline and closed revenue.
After a lead comes in, the value you get from it comes down to how fast your team responds, how consistently they follow up, and how well they progress real opportunities.
Outreach agentic AI platform for revenue teams, helps here by increasing the revenue you generate from every lead you have already paid for, rather than changing what that lead cost in the first place.
With Outreach, revenue teams can:
When you combine realistic CPL benchmarks with consistent execution, you are no longer only managing cost per lead. You are deliberately improving revenue per lead, which is the metric that matters most when acquisition costs are trending up.
Get a walkthrough of how Outreach helps revenue teams convert pipeline into revenue through consistent follow-up, AI-assisted personalization, and forecasting that connects acquisition spend to downstream outcomes.
Most 2026 benchmark data places B2B SaaS blended CPL at around $237, with organic CPL closer to $164 and paid CPL around $310 according to First Page Sage. A good CPL depends on your deal size, conversion rates, and channel mix rather than a single industry number.
Both industries face expensive paid search keywords, long sales cycles, regulatory constraints on messaging, and cautious buyers who require significant trust-building content. High customer lifetime values and large deal sizes typically justify the elevated acquisition costs, making the CPL reasonable in context.
Use blended CPL for planning, budgeting, and external benchmarking since it reflects the full cost of your demand generation program. Use channel-level CPL for internal optimization decisions, especially when evaluating which channels to scale, reduce, or rebalance within your overall mix.
Not at all. Industries with large average contract values and long customer lifetimes routinely carry CPLs above $500. What matters is the ratio of CPL to downstream conversion and revenue. A higher CPL that converts at a strong rate often produces better unit economics than a cheap lead that never closes.
Review benchmarks at least annually, ideally as part of your budget planning cycle. Paid search costs have continued to rise, so benchmarks from even two years ago may significantly understate current market rates and lead to unrealistic planning assumptions.